END and RAPID Maps
Test Sets

Test sets analyzed in

Lang PT et al. Protein structural ensembles are revealed by redefinig x-ray electron density noise. PNAS USA. 111 237-247

Description

Structures and X-ray data were obtained from the PDB (http://www.pdb.org).For the 485 X-ray crystal structures in the1.0-1.7-Å-resolution set, the R-values were less than 0.22 and mutual sequence identity was <95%. For the 1.0-3.5-Å-resolution structures, the R-vales were less than 0.1 times the resolution, the mutual sequence identity was <30%, and the molecular weight was <80,000 kDa. Coordinate and structure factor files were converted and refined for five macrocycles using phenix.refine. For the 74 hen egg white lysozyme structures, all structures had 100% sequence identity and were in the P43212 space group with unit cell edges of 78.76±0.43Å x 78.76±0.43Å x 37.53±0.50Å. When not available, R-free flags were automatically generated. In addition to default parameters, automatic optimization of weights was enabled, as were anisotropic B-values for data better than 1.6-Å resolution. Hydrogens were added to models at <2.0-Å resolution.

Lists of Protein Databank IDs

Structures with resolutions between 1.0-1.7Å (downloaded June 2010)
Structures with resolutions between 1.0-3.5Å (downloaded July 2012)
Hen egg white lysozyme structures (downloaded March 2012)

Selected Figures:

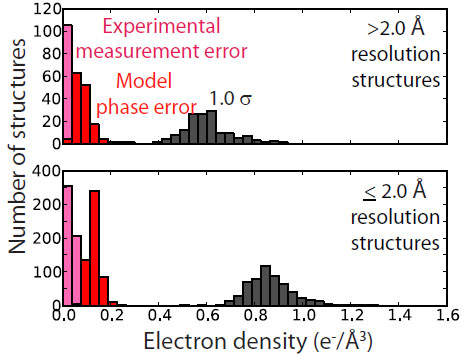
END and RAPID maps define the absolute scale and noise level of electron density. Values for 1 standard deviation (σ) above the average of electron-density (gray) and average RAPID noise resulting from mFo-DFc (model-based; red) or from σ(Fobs) (experiment-based; pink) are influenced by the resolution of the data. Lower resolution maps (≥2.0-Å resolution, top) have broader features with generally lower σ and noise values.
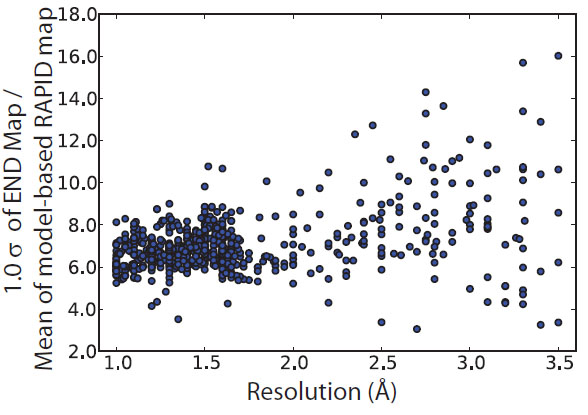
The 1σ threshold overestimates noise by 6-8 fold. Ratio of the 1σ value to the average value of the noise due to model errors determined by the RAPID procedure for 685 representative structures in the Protein Data Bank.
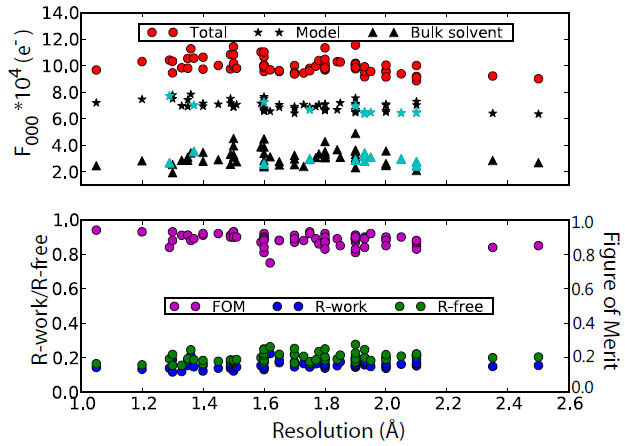
Values of F000 are stable as a function of resolution. The F000 values (red), as well as the bulk solvent (triangles) and model components (stars), are consistent across 68 hen egg white lysozyme data sets with a range of resolutions.The phase accuracy as measured by figure of merit (magenta) and model quality as measured by R-work (blue) and R-free (green) are plotted for comparison. A subset of structures (cyan) with highly similar crystallization conditions—50-100 mM sodium acetate and 3-8% (w/v) sodium chloride—confirms that the variation in F000 across the set is due primarily to differences in solvent composition in the crystals.