Ringer
Test Sets

Test set analyzed in

Lang PT et al. Protein structural ensembles are revealed by redefinig x-ray electron density noise. PNAS (in press).

Description

Structures and X-ray data were obtained from the PDB (http://www.pdb.org). For the 485 X-ray crystal structures in the1.0-1.7-Å-resolution set, the R-values were less than 0.22 and mutual sequence identity was <95%.  

Lists of Protein Databank IDs

Structures with resolutions between 1.0-1.7Å (downloaded June 2010)

Selected Figures:

Signal and noise quantified using Ringer to sample electron density in an END Map (black) and a RAPID map (red shading) as a function of side-chain dihedral angle. The example shown is Met344 from PDB ID 3BON (1.20 Å resolution).
END and RAPID maps reveal signal for unmodeled, low-population side-chain conformations. Histogram of unmodeled, secondary chi1 electron density peaks from Ringer plots above the noise (red) and above 0.4 e-/Å3 (blue).
Correlated unmodeled chi1 and chi2 peaks for side chains unbranched at chi1 in 485 high-resolution structures. Three-dimensional histogram of correlated secondary chi1 Ringer peaks and primary chi2 Ringer peaks (both above 0.4 e-/Å3 in END Maps) built from the unmodeled secondary chi1 peaks for 31,086 side chains unbranched at chi1. The non-random, low-energy, “checkerboard” distribution suggests that unmodeled side-chain conformations are common.


Test sets analyzed in

Lang PT et al. Automated electron-density sampling reveals widespread conformational polymorphism in proteins. Protein Sci. 2010 Jul;19(7):1420-31.

Description

Model files and structure factors were downloaded from the PDB web-site (http://www.pdb.org) based on (a) the availability of the experimental X-ray amplitudes, (b) resolution <1.5 Å, (c) R factor <0.22, (d) lack of homology to other proteins in the test set, and (e) absence of nucleic acids. For test structures >1.5Å resolution, PDB files and structure factors were filtered to remove metalloproteins. The remaining structures were clustered by homology and selected for uniqueness. Representatives were chosen randomly to give an average of 44 structures for each resolution bin.

Lists of Protein Data Bank IDs

Structures with resolution less than 1.5Å (downloaded June 2008)
Structures with resolutions between 0.6-3.0Å (downloaded July 2009)

Selected Figures:

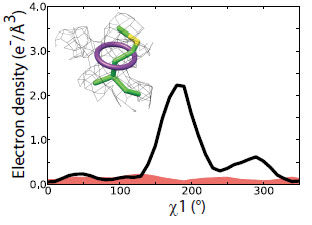
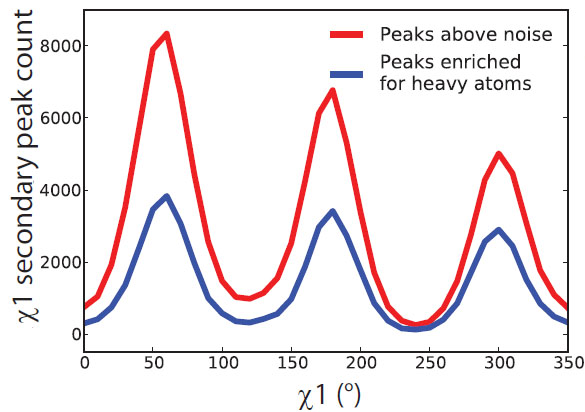
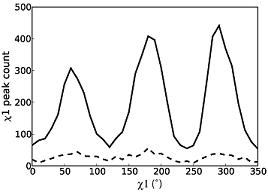
Weak electron-density features are enriched in rotameric positions. Distribution of secondary peaks (solid line) >0.3 sigma versus chi1 angle shows a trimodal distribution strongly enriched for preferred rotameric positions. The distribution of tertiary peaks (dotted line) >0.3 sigma shows a similar tri-modal distribution.
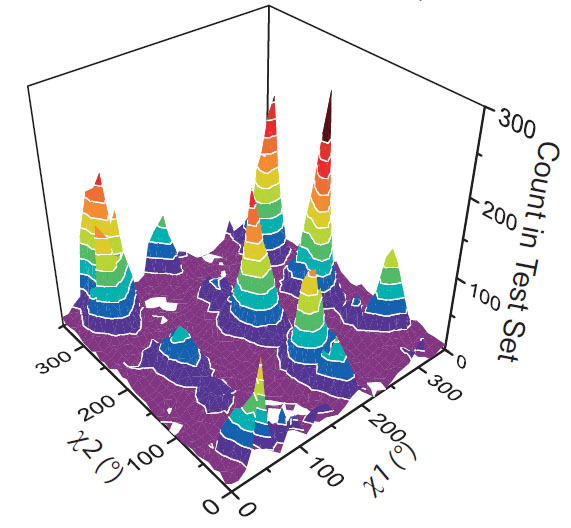
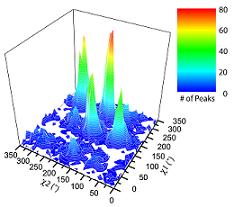
Ringer detects peaks at correlated chi1 and chi2 angles.A histogram of secondary chi1 peaks and primary chi2 peaks built from the unmodeled chi1 peaks. Crosspeaks are significantly enriched in rotameric positions (P-value < 10^-5).
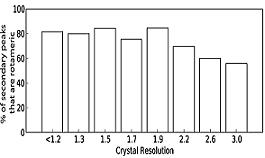
Resolution dependence of Ringer peak detection at the 0.3 sigma threshold.The percentage of secondary Ringer peaks within 30º of rotameric angles over a range of resolutions.