Ringer Users Manual
Authors:
P. Therese Lang
Ho-Leung Ng
Tom Alber
Copyright © 2010
Regents of the University of California
All rights reserved
Last updated March 2013
1.1. Why study side-chain dynamics?
Proteins populate structural ensembles that mediate folding, ligand binding, catalysis, signaling, and evolution. Recent developments in NMR spectroscopy have provided new insights into the relationship between structure, function, and dynamics. X-ray crystallography complements these techniques by providing detailed structural data on the nature of conformational polymorphism. Crystal structures are traditionally used to define protein dynamics by analyzing B-values, by detection of conformational differences in independent molecules within the same asymmetric unit, or independent crystal structures. In addition, proteins in crystals exchange hydrogens with solvent, undergo reversible conformational changes, and catalyze chemical reactions as complex as DNA polymerization. These and many other examples indicate that proteins in crystals can undergo small- and large-scale motions and populate diverse conformations.
In contrast to this evidence for conformational polymorphism, ~95% of residues in the crystal structures in the Protein Data Bank (PDB) are modeled by a single conformation. Crystal structures are typically built by interpreting electron density maps at 1 standard deviation (sigma) greater than the mean electron density of the unit cell. Although it represents a variable absolute electron density, this 1 sigma level is often considered to approximate the boundary between the signal from the molecule and the noise in the electron-density map. At high resolution, disorder can be modeled explicitly with the placement of alternate conformers into the electron density. To describe localized motions, atomic B factors represent a Gaussian decay of the electron density of the modeled atoms. To represent large-scale and collective motions, refinement may also include grouped anisotropic B factors. Because they combine contributions from motions, static disorder and model errors, however, B factors can disguise discretely disordered alternate side-chain and main-chain conformations.
To determine if electron density maps contain signals for small populations of alternate side-chain conformations, we developed a computational method, Ringer. Ringer automatically samples electron density around the side-chain dihedral angles of a structural model and identifies peaks that correlate with structural features. Using Ringer, we uncovered evidence suggesting unmodeled, alternate conformations in over 18% of side chains in a diverse set of 402 high-resolution structures in standard sigma-scaled maps. More recently, we applied Ringer to absolute-scaled electron density maps (END Maps) and looked for alternate conformations all the way down to the true noise level (as defined by RAPID Maps). In this study, we identified unmodeled conformations above the noise for 45% of side chains in a set of 485 representative proteins.
1.2. What can Ringer do for you?
More than a method for enhancing crystallographic refinement, however, Ringer is best used as a tool for systematically detecting low-occupancy structural features. The hidden conformational substates identified using Ringer provide clues to the functional roles of protein structural polymorphism and to assess the response of protein side chain distributions to perturbations including ligand binding, temperature changes and mutations. With this new quantitative view, we can compare directly maps of different structures, confidently interpret the lower values of electron density, and define the physical relevance of weak features. Ringer has been applied to identify changes in side-chain ensembles in a range of biological systems. High-resolution structures of calmodulin (CaM) have been compared in both an open state and bound to a peptide, suggesting these motions are related to folding and substrate recognition (1). It has also been used to delineate allosteric pathways critical for regulation in cyclophilin A (2), protein lysine actyltransferase (3) and protein kinases (4).
These alternate structures provide a more dynamic picture of protein conformation and ligand binding. The alternate conformations identified by Ringer provided structural insights not available from any other experimental technique. In general, these results indicate that systematic sampling of weak electron density features reveals conformational diversity in electron density maps that has been overlooked by traditional model building and refinement practices. These newly characterized conformations can be used to provide insights linking side-chain motions with protein function and drug binding.
NOTE FOR NON-LINUX USERS: Ringer must be run using a Unix-like environment. For Macs, you will need to use the terminal window. For Windows, we typically use Cygwin (http://www.cygwin.com/) with a full Unix installation, including compilers and Unix shells.
1) Ringer is dependent on the external program Chimera (5). Go to the Chimera website (http://www.cgl.ucsf.edu/chimera/) and follow the installation instructions.
NOTE: Ringer has been tested and validated using the current production release (version 1.8). If you use a different version and find problems, please contact us at ringer-users
lists.berkeley.edu with a description of the problem and the error message.
OPTIONAL: In the new release of Ringer, there is an accessory script that will create Ringer plots after a run is complete. If you would like to use this accessory, you will need to install matplotlib as well. Read more about the accessory here.
2) Save the distribution in the directory you want it installed in. Unpack the distribution using the following command:
[user@ringer ~] tar -zxvf ringer2.0.tar.gz
3) Set the following environment variables: CHIMERA_HOME should point to the directory where Chimera is installed; RINGER should point to the directory where Ringer is installed. For example:
Linux Environment using tcsh
setenv CHIMERA_HOME /home/terry/programs/chimera
setenv RINGER /home/terry/bin/ringer-2.0Mac OS X Environment using bash
export CHIMERA_HOME=/Applications/Chimera.app/Contents/Resources
export RINGER=/Users/terry/ringer-2.0NOTE: For Mac Users, the CHIMERA_HOME variable needs to point to the Resources directory in the standard Chimera installation.
Windows (Cygwin) Environment using bash
export CHIMERA_HOME="/cygdrive/c/Program Files/Chimera/"
export RINGER='C:\Program Files\Cygwin\home\terry\ringer-2.0'NOTE: For Windows users, the CHIMERA_HOME variable needs to use the Cygwin-based path. The RINGER variable needs to use the MS-DOS-based path.
4) Test the installation
[user@ringer ~] cd $RINGER/test
[user@ringer ~] make
#The tests should complete in less than five minutes[user@ringer ~] make check
#This command will list any differences uncovered during testing.[user@ringer ~] make clean
#This command cleans up after the test is completeNOTE: Some failures are not significant. For example, differences in the tails of decimals may not be significant. The sources of such differences are frequently platform dependencies from computer hardware, operating systems, and compilers that impact arithmetic precision and random number generators.
The aim of Ringer is to go beyond static structural snapshots of proteins by uncovering structural ensembles in X-ray electron density. This information can reveal not only which parts of proteins are flexible and which part are rigid, but it also can define alternate conformations that may be important for function. Alternate conformations of binding sites also may afford additional targets for drug design.
 |
 |
 |
|
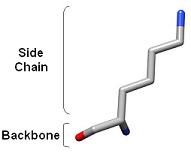
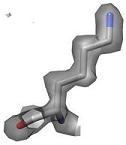
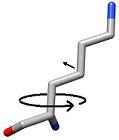
1) Ringer detects localized protein motions by sampling around the side chains. The backbone is held rigid.
|
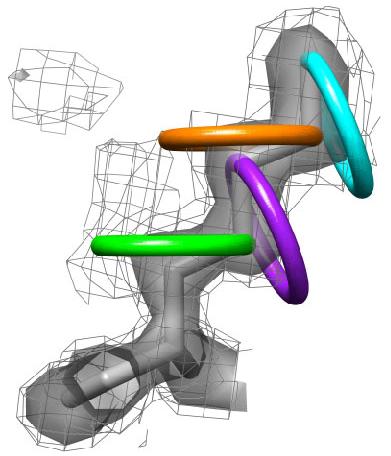
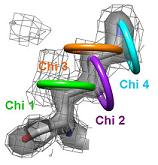
2) The side chain motions are identified by a systematic search of X-ray electron density. Shown here is the electron density for Lys86 from
a putative tyrosine phosphatase (PDB ID 2HHG). The electron density is contoured at 1.0 sigma, which is the standard threshold when building a structure. |
3) Each side chain is sampled in rings by rotating the terminal heavy atom (gamma for chi 1) around the chi angle in user defined increments. |
 |
 |
 |
4) At each sampled point, Ringer interpolates the electron-density value from the map. All electron-density values are considered, including contours below the standard 1.0 sigma cutoff. Shown here, for example, is the 0.3 sigma contour (mesh). |
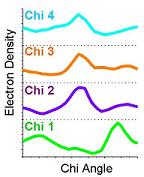
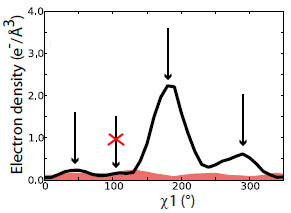
5) The electron density values are plotted in two-dimensions against the sampled chi angles. |
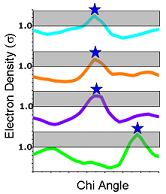
6) Ringer then picks electron-density peaks from the plots. In this example, Ringer identifies all peaks above the 1.0 sigma cutoff (grey bar). A single peak (blue stars) is found for each chi angle, each of which corresponds to the built conformation. |
 |
 |
|
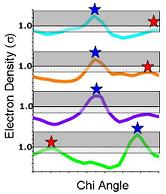
| 7) Ringer can also identify peaks below the standard cutoff. In this example, Ringer identifies an additional three peaks (red stars) above the 0.3 sigma contour (grey mesh)--evidence for additional, currently unmodeled conformations. | 8) NEW: Signal and noise can be quantified using Ringer to sample electron density in END (black) and RAPID maps (red shading). Peaks below the Ringer plot from the RAPID plot are filtered out (red x). A lower sigma cutoff to separate alternate conformations from hydrogens can still be applied. | |
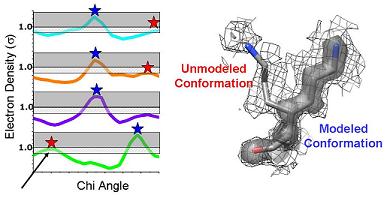 |
Beyond Ringer: Ringer prints out the electron density vs chi angle plots as well as lists of peaks above a user-defined cutoff. With these data, the user can go back to the model and build in the alternate conformations. In this example, the secondary peak identified for the chi 1 angle (arrow) corresponds to an alternate conformation that has been been built into the electron density for the 0.3 sigma contour. |
|
Ringer must be run from the command line in a standard unix shell.
USAGE:
[users@ringer ~] $RINGER/ringer/ringer -i ringer.in [-o ringer.out]OPTIONS:
-i ringer.in #input file containing user-defined parameters
-o ringer.out #output file containing the parameters used in the calculation, summary information for each analyzed protein, and warning messages
Ringer analyzes crystallographic electron density using atomic coordinate files in standard PDB format. Electron density must be in the form of maps. The electron density maps can be computed from structure factors deposited in the PDB, downloaded from the Uppsala Electron Density Server, or calculated in the course of crystallographic refinement. Ringer reads electron density maps in CCP4, X-PLOR, and CNS file formats. The maps are expanded to ensure they cover the entire model. The sigma values in the map are scaled to ensure a mean electron density of 0 sigma and a standard deviation of 1 sigma. This scaling includes all voxels in the electron density, and it emulates the standard scaling in the commonly used modeling program, Coot. In Ringer 2.0, absolutely-scaled END Maps and RAPID noise maps can also be used.
Click here for a tutorial on how to use Ringer.
The parameter definitions will use the following format:
parameter_name [default] (value)
File Input
The pdb-formated coordinate model file and electron density map must be defined. The absolute path can be optionally added.
map_name [None] (string)
pdb_name [None] (string)Optionally, a RAPID noise map can be read in as well. When a RAPID map is read in, Ringer will also sample the noise map. Any peaks in the signal (END) map that is below the corresponding Ringer plot in the noise (RAPID) map will be filtered out. RAPID maps should ONLY be used in conjunction with absolute-scaled maps.
noise_map_name [None] (string)
The type of scaling for the map must be declared. If using a standard map from Coot, Phenix, CCP4, etc, use sigma to denote a sigma-scaled map. If using an absolute-scaled END map, use volume to denote that the file is on the scale of electrons per cubic angstrom.
map_type [sigma] (sigma, volume)
Side Chain Perception
Each chi angle is defined based on the modeled side chains. Chi 1 angles are built starting at the backbone nitrogen.
For residues with alternate conformations included in the model, Ringer either samples using the higher-occupancy conformation (off) or excludes the side chain from the analysis (on).
skip_multi_conf [on] (off,on)
Sampling Options
The bond length and angle used for moving the terminal atom is controlled by one of three options:
With all sampling options, dihedral angles that terminate in hydrogens are sampled with a standard sp3 carbon bond length of 1.53 Å and angle of 111.1°.
atom_sample_type [dynamic] (constant, experimental, dynamic)
The dihedral angles are systematically sampled by a changeable absolute torsion angle
chi_sample_degree [10] (integer)
The electron density at each point is extrapolated from the map electron density in Cartesian space by trilinear interpolation.
The electron density (in units of sigma) is plotted versus the sampled chi angles for peak identification. Peaks are identified as the maxima in the plots of sigma vs. chi angle above the user-defined lower cutoff in units of sigma.
lower_sigma_cutoff [0.3] (float)
Peaks also can be restricted below a user-defined upper threshold. This filter helps to focus on peaks that represent low population conformations below the standard 1.0 sigma noise cutoff. If upper_sigma_cutoff is set to off, upper_sigma_cutoff_value is ignored.
upper_sigma_cutoff [off] (on,off)
upper_sigma_cutoff_value [0.8] (float)Verbose Output Options
The raw data to generate the electron density vs chi angle plots can be printed for amino acid types. The plots for all amino acids and chi angles sampled will be generated. The outputted file can then be processed by the plotting accessory or read directly into a plotting programming like excel or gnuplot. If a RAPID map is used, the Ringer plots from the noise map will be automatically generated as well.
write_plot [off] (on,off)
Ringer can also print out the list of peaks identified from the electron density vs chi angle plots above the user defined cutoff. Because Ringer identifies alternate conformations based on density peaks beyond the primary peak, only unbranched torsion angles are chosen for each chi angle category. The identified peaks are divided into chi angle-based categories:
chi 1 = Ser, Gln, Asn, Glu, Asp, Arg, Lys, Met, Cys, and Leu
ring = Phe, Tyr, Trp, and His
chi 2 = Gln, Glu, Arg, Lys, Met, and Ile
chi 3 = Lys, Arg, and Met
chi 4 = Lys and Argwrite_peak_list [off] (on,off)
In reference 1 and 4, Arg, Asn, Asp, Gln, Glu, Leu, Lys , and Met residues were used for chi 1/ chi 2 checkerboard correlation analysis. The user has the option to print out the raw data used to generate this plot as well.
write_chi2chi1 [off] (on,off)
The user has the option to write out various verbose portions of data from the calculation. The prefix of these files can be modified
verbose_outfile_prefix [ringer] (string)
The purpose of the plotting accessory is to simplify access to Ringer plots. The default behavior is to print out the data for the chi angle of a particular residue in tab-delimited format. If a noise map has been included in the Ringer analysis, the Ringer plot from the noise map will be included as well. If the matplotlib python library is installed and the appropriate flag is set, the program will also pop-up a Ringer plot that can be saved in a desired formt. The plotting accessory must be run from the command line in a standard unix shell.
USAGE:
[users@ringer ~] $RINGER/ringer/create_ringer_plot --residue=RESIDUE --input_prefix=PREFIX [--haveMatPlotLib] [--help]OPTIONS:
--residue=RESIDUE #exact name and chi angle of interest (e.g. LYS_A_29_chi1); use title line of XXX.signal_plot.txt as an example of format
--input_prefix=PREFIX #prefix name of plot files
--haveMatPlotLib #If the matplotlib python library is installed and the flag is set, the accessory will create a Ringer plot for the residue (black solid line). If a RAPID map has been included in the Ringer analysis, the plot will automatically include the noise plot as well (red dashed line). If the flag is not set, the accessory will default to printing out just the requested residue data in tab-delimited form to a file called XXX_ring.txt.
Peaks detected by Ringer currently require manual inspection and building of alternate conformers. Corroboration of individual alternate conformers should be obtained from Fo-Fc difference density, coupled backbone shifts, and connected electron density corresponding to the entire side chain. Non-rotameric peaks, which can arise from coupled main-chain shifts or high-energy conformations, can be difficult to build by visual inspection. We suggest using Ringer iteratively with model building and occupancy refinement. Side-chain conformations added to the model to fit Ringer peaks should be validated by small improvements in map quality and interpretability, real space correlation coefficients between Fc and Fobs, the consistency of B values and R/Rfree values.
1. Lang PT, Ng HL, Fraser JS, Corn JE, Echols N, Sales M, Holton JM, Alber T. Automated electron-density sampling reveals widespread conformational polymorphism in proteins. Protein Sci. 2010 Jul;19(7):1420-31.
2. Fraser JS, Clarkson MW, Degnan SC, Erion R, Kern D, Alber T. Hidden alternative structures of proline isomerase essential for catalysis. Nature 2009;462(7273):669-673.
3. Lee HJ, Lang PT, Fortune SM, Sassetti CM, Alber T. Cyclic AMP regulation of protein lysine acetylation in Mycobacterium tuberculosis. Nat Struct Mol Biol. 2012;19(8):811-8.
4. Lang PT, Holton JM, Fraser JS, Alber T. Protein structural ensembles are revealed by redefining x-ray eletron density noise. PNAS. (in press)
5. Pettersen EF, Goddard TD, Huang CC, Couch GS, Greenblatt DM, Meng EC, Ferrin TE. UCSF Chimera - A visualization system for exploratory research and analysis. J. Comput. Chem. 2004;25(13):1605-1612.
6. Cornell WD, Cieplak P, Bayly CI, Gould IR, Merz KM, Ferguson DM, Spellmeyer DC, Fox T, Caldwell JW, Kollman PA. A second generation force field for the simulation of proteins, nucleic acids, and organic molecules. J Am Chem Soc 1995;117:5179–5197.